Studio Actuals
Studio Actuals provide a company wide overview of all jobs within a selected date range. Studio Actuals are non-editable and for analysis purposes only. Information here can be filtered to show the full job amount if the job occurs in the time period or amortized based on the percentage of the job within the given date range. Tabs include a general financial overview, a breakdown of timecards and time spent on jobs, a summation of time and expenses categorized by Task and by User, profit center margins, as well as a break down of individual job margins.
To open Studio Actuals, click on the Studio > Actuals item from the Main Menu.
Studio Actuals are comprised of 6 sections:
Overview |
Charts relating to Awarded Total, Cost, Profit, and Margin per location |
Margins |
Financial totals for each job including bids, projections, actuals, and invoices |
Profit Centers |
Totals for awarded amounts, hardcost, profit, and margins per profit center defined |
Tasks |
A breakdown of time per task type including total time and total cost based on timecards and the rate of the user |
Users |
A breakdown of time per user including total time and total cost |
Timecards |
Displays graphs showing the breakdown of time spent per rate as well as bid items, locations, and users |
Each tab within Studio Actuals is divided into two sections, a dashboard and the section data below.
Studio Actuals Dashboard
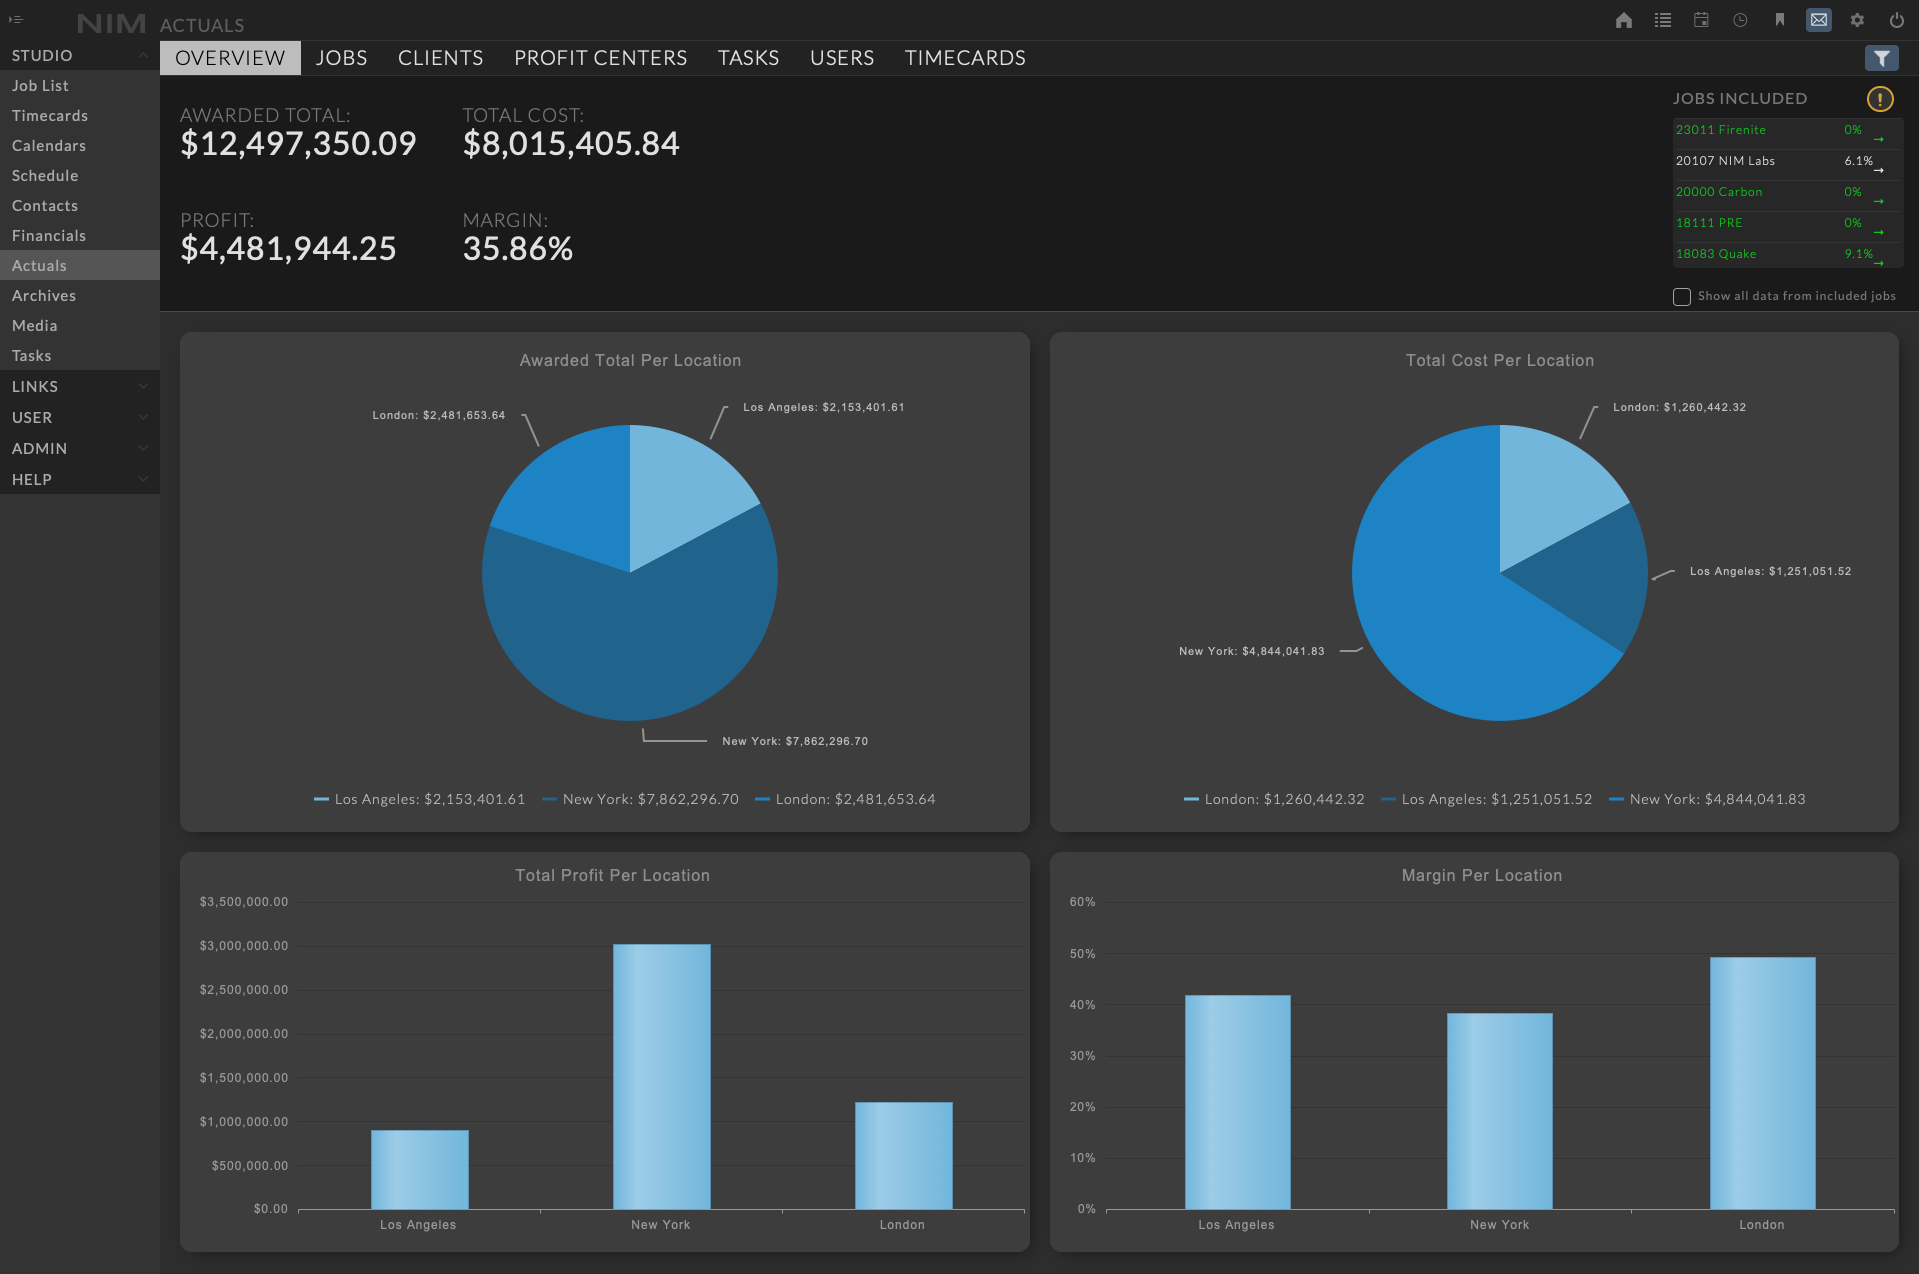
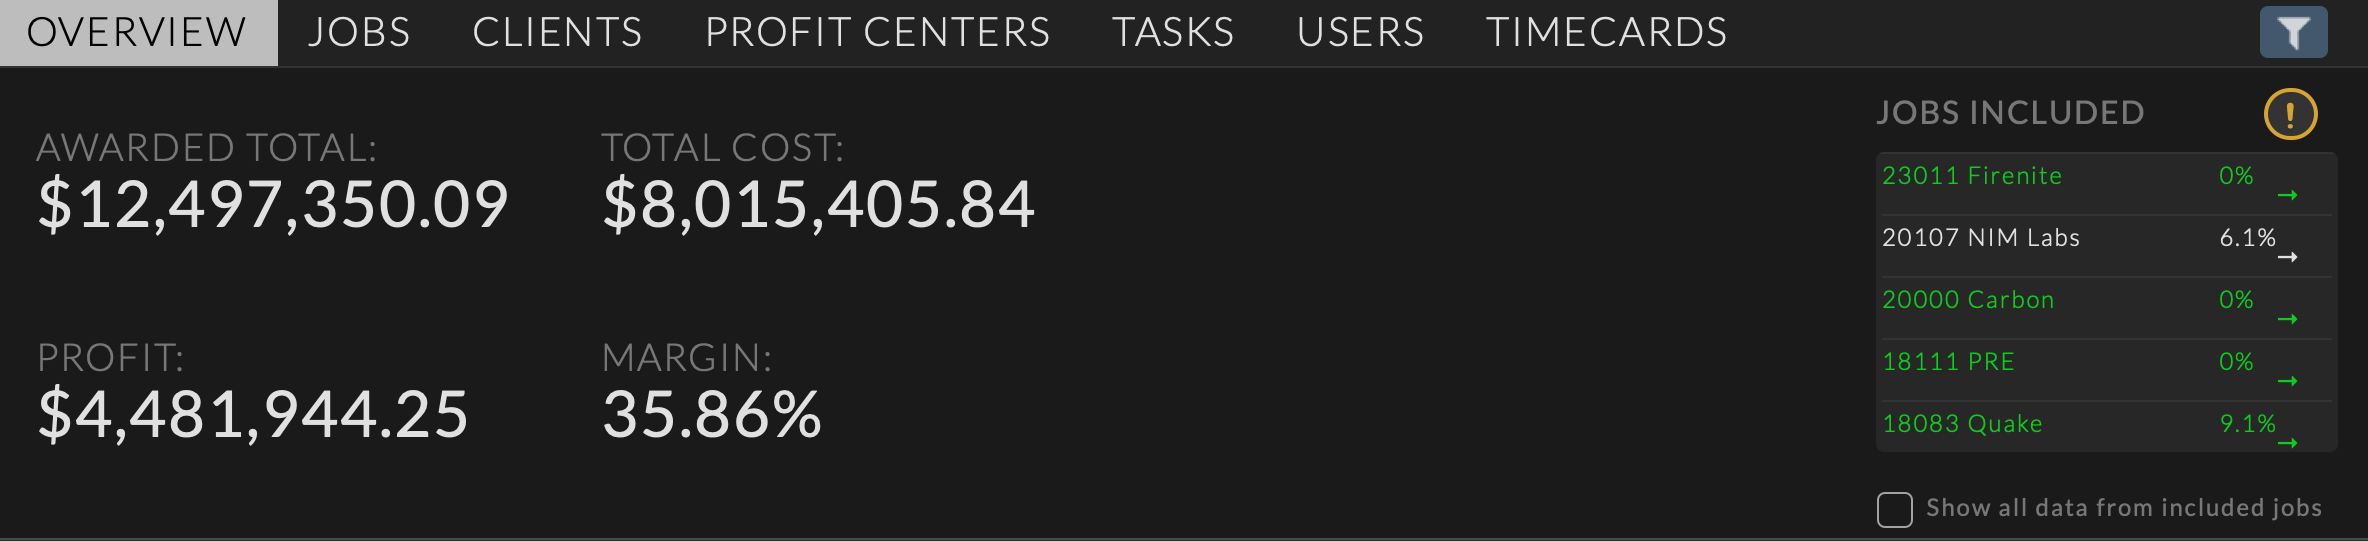
The Studio Actuals Dashboard displays summarized information related the studio wide financial totals and filtering tools to determine the range of included jobs and how their data is interpreted.
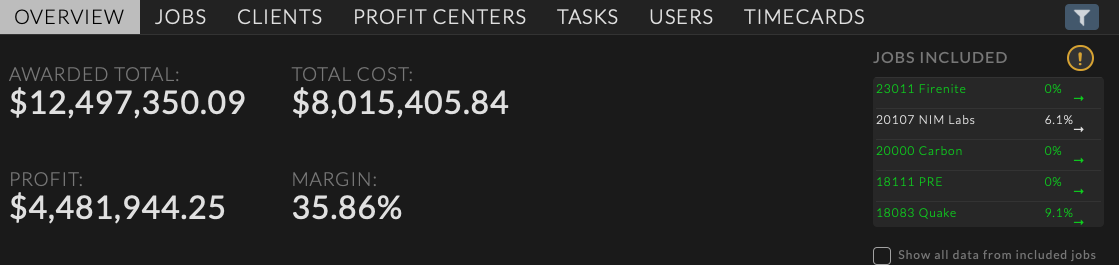
The dashboard includes totals for:
Awarded Total
Total Cost
Profit
Margin
These values are derived from the jobs and timecards which overlap the period of time defined by the start and end date filters. If a job filter is selected, only the data relating to that job will be shown.
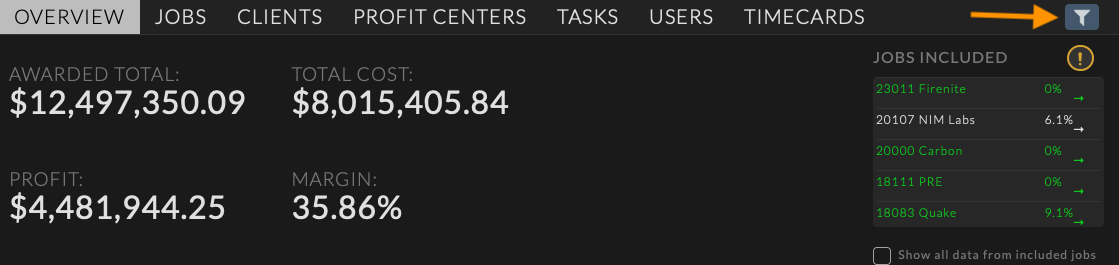
At the right of the panel are filtering options:
- Filter:
Job
Start Date
End Date
A list of Jobs Included displaying what jobs are currently included in the data and the percentage of the job that overlaps the date range selected.
An option to show all data from included jobs.
To open the filter options, click the filter button at the top right of the dashboard. When a filter is active, the filter button will be highlighted.
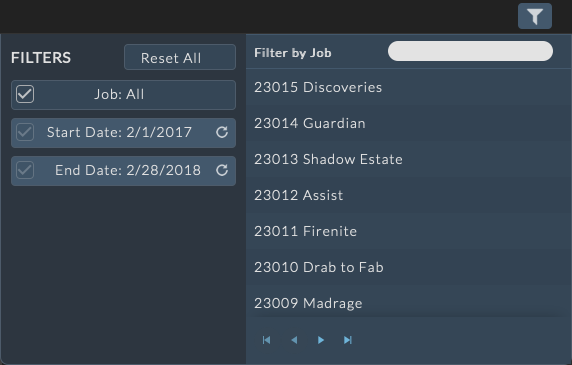
Job Filter
Studio Actuals may be filtered by a single job.
To filter by a job, open the filter panel and then click the Job button from the Filters list.
The filter panel will expand allowing the user to select a job.
Clicking on a job in the list will immediately apply the filter.
Note
When filtering by job, the start and end date filters are disabled so all timecards on the job will be displayed. The time filters can be applied by clicking on the checkbox next to Start Date and End Date to re-enable the filter.
Time Filter
Studio Actuals may be filtered by time.
To filter by a job, open the filter panel and then click the Start Date or End Date button from the Filters list.
The filter panel will expand allowing the user to select a date.
Clicking on a date in the mini calendar will immediately apply the filter.
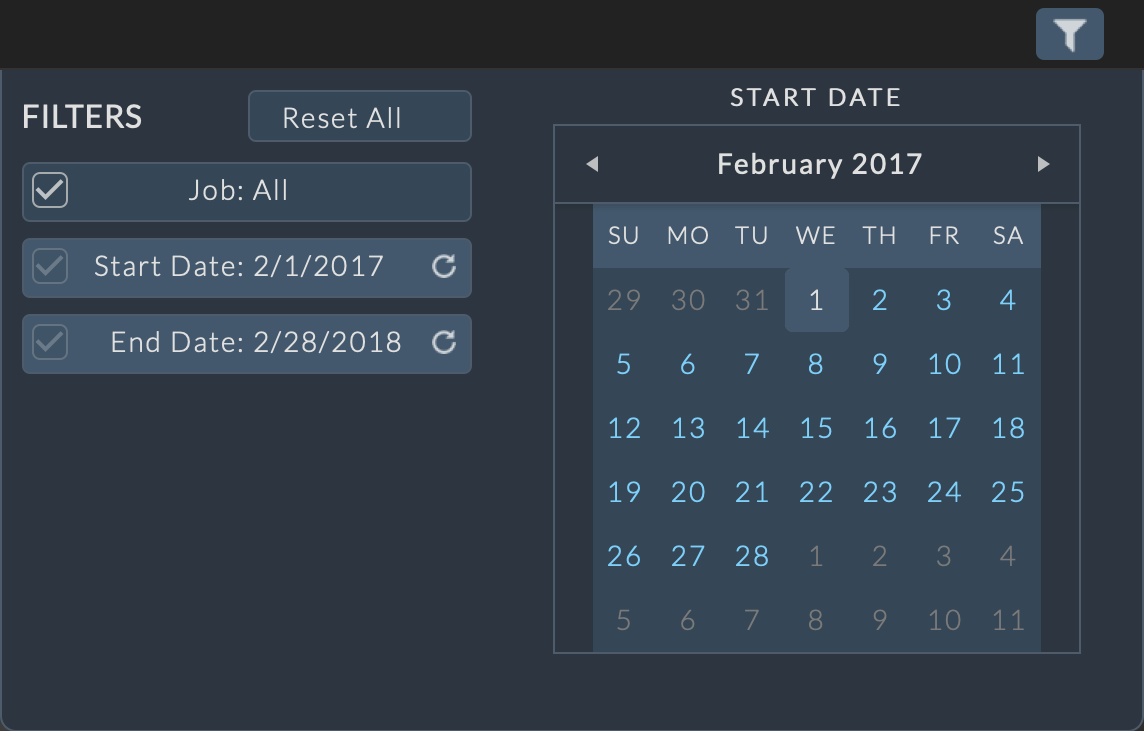
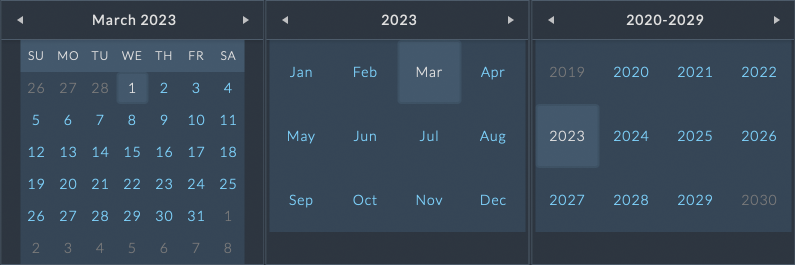
Inside the mini calendar, click the title bar to adjust the zoom level of the date range to select.
Clicking on March 2023 will zoom out the mini calendar to show a list of months.
Clicking on 2023 when viewing months will zoom out to show a list of years.
Clearing Filters
Filters may be individually enabled and disabled by clicking the checkmark box to the left of each filter.
 - enables the filter
 - disables the filter
To reset all filters click the Reset All button at the right of the Filter panel
Show All Data
Below the filter options is a checkbox to Show All Data from Included Jobs.
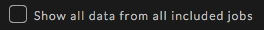
This checkbox determines how much of the included job’s data is displayed.
When unchecked, the data being represented is a subset of the total job multiplied by the percentage of the job that overlaps the filtered date range.
When checked, the data being represented is the full value of the included jobs regardless of the start and end date filters.
Jobs Included
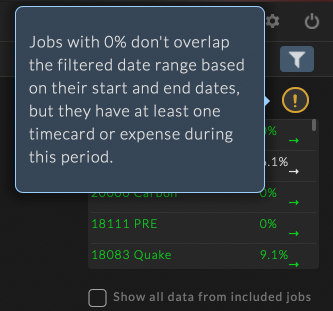
This list identifies the jobs being included in the data. If a job’s start or end date falls within the filtered start and end time, or contains a timecard or expense that falls within the filtered start and end time, it will be included in the list.
If a job’s start and end date does not fall within the filtered date range but does contains a timecard or expense that falls within the filtered date range an alert will appear below the filter options.
Holding the cursor over the alert will list the jobs in question as well as further information to correct the situation.
Holding the cursor of the Included Jobs list brings up a tool tip further explaining the data being represented.
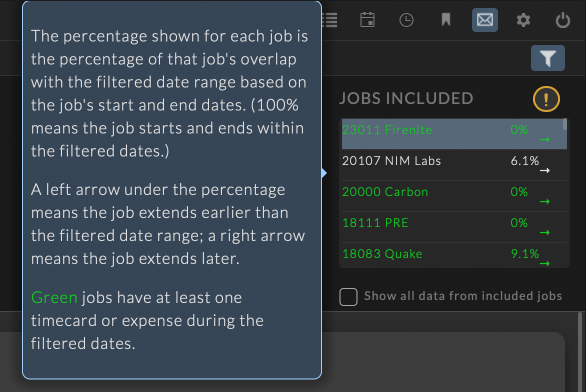
The percentage shown for each job is the percentage of the job’s overlap with the filtered date range based on the job’s start and end dates.
100% means that the jobs start and end dates fall within the filter start and end dates.
A left arrow under the percentage denotes the job extends earlier than the filtered date range and conversely a right arrow denotes that the job extends past the filtered date range.
Jobs marked in Green contain at least one timecard or expense for the filtered date range.
Summarized Totals
At the left of the dashboard are summarized totals for:
- Awarded Totals
This is the sum of each included job’s Actual total multiplied by it’s overlap percentage.
If Show data from all included jobs is unselected the full value of each job is calculated regardless of how it falls in the filtered date range.
- Total Costs
This is the total of all timecard and expense-based costs during the filtered date range, plus any additional costs from the included jobs multiplied by the overlap percentage.
If Show data from all included jobs is unselected the full value of each job is calculated regardless of how it falls in the filtered date range.
- Overall Profit
This is calculated as Awarded Total - Total Cost
- Overall Margin
This is calculated as Overall Profit / Awarded Total
Excel Export
Click the  button (if available) to export the current tabs breakdown to Excel.
Overview
The Overview tab is selected by default when opening Studio Actuals.
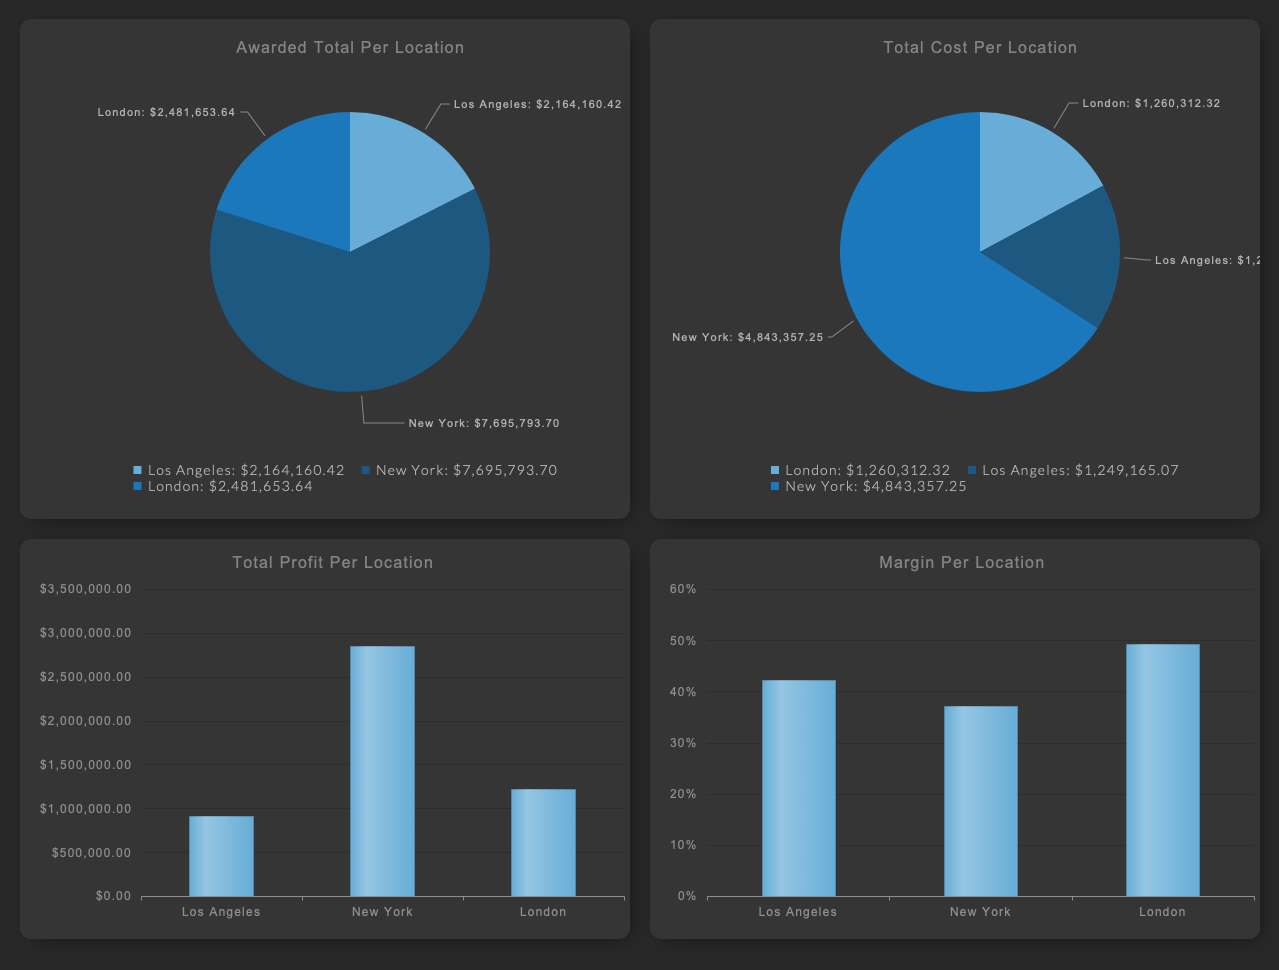
There are four graphs presented on this page:
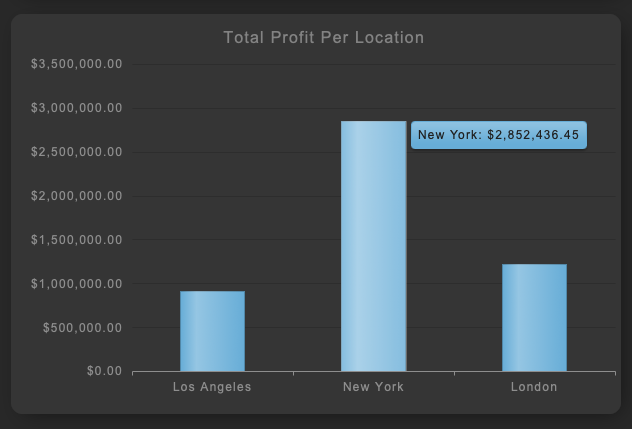
Awarded Total Per Location
Total Cost Per Location
Total Profit Per Location
Margin Per Location
In either pie chart, clicking on an item in the legend will hide and unhide that value in the chart.
In the bar graph, hovering the cursor over a bar will display the exact value for the item.
Job Margins
The Jobs tab displays a grid of actualization information related to all jobs with awarded bids overlapping the filtered date range.
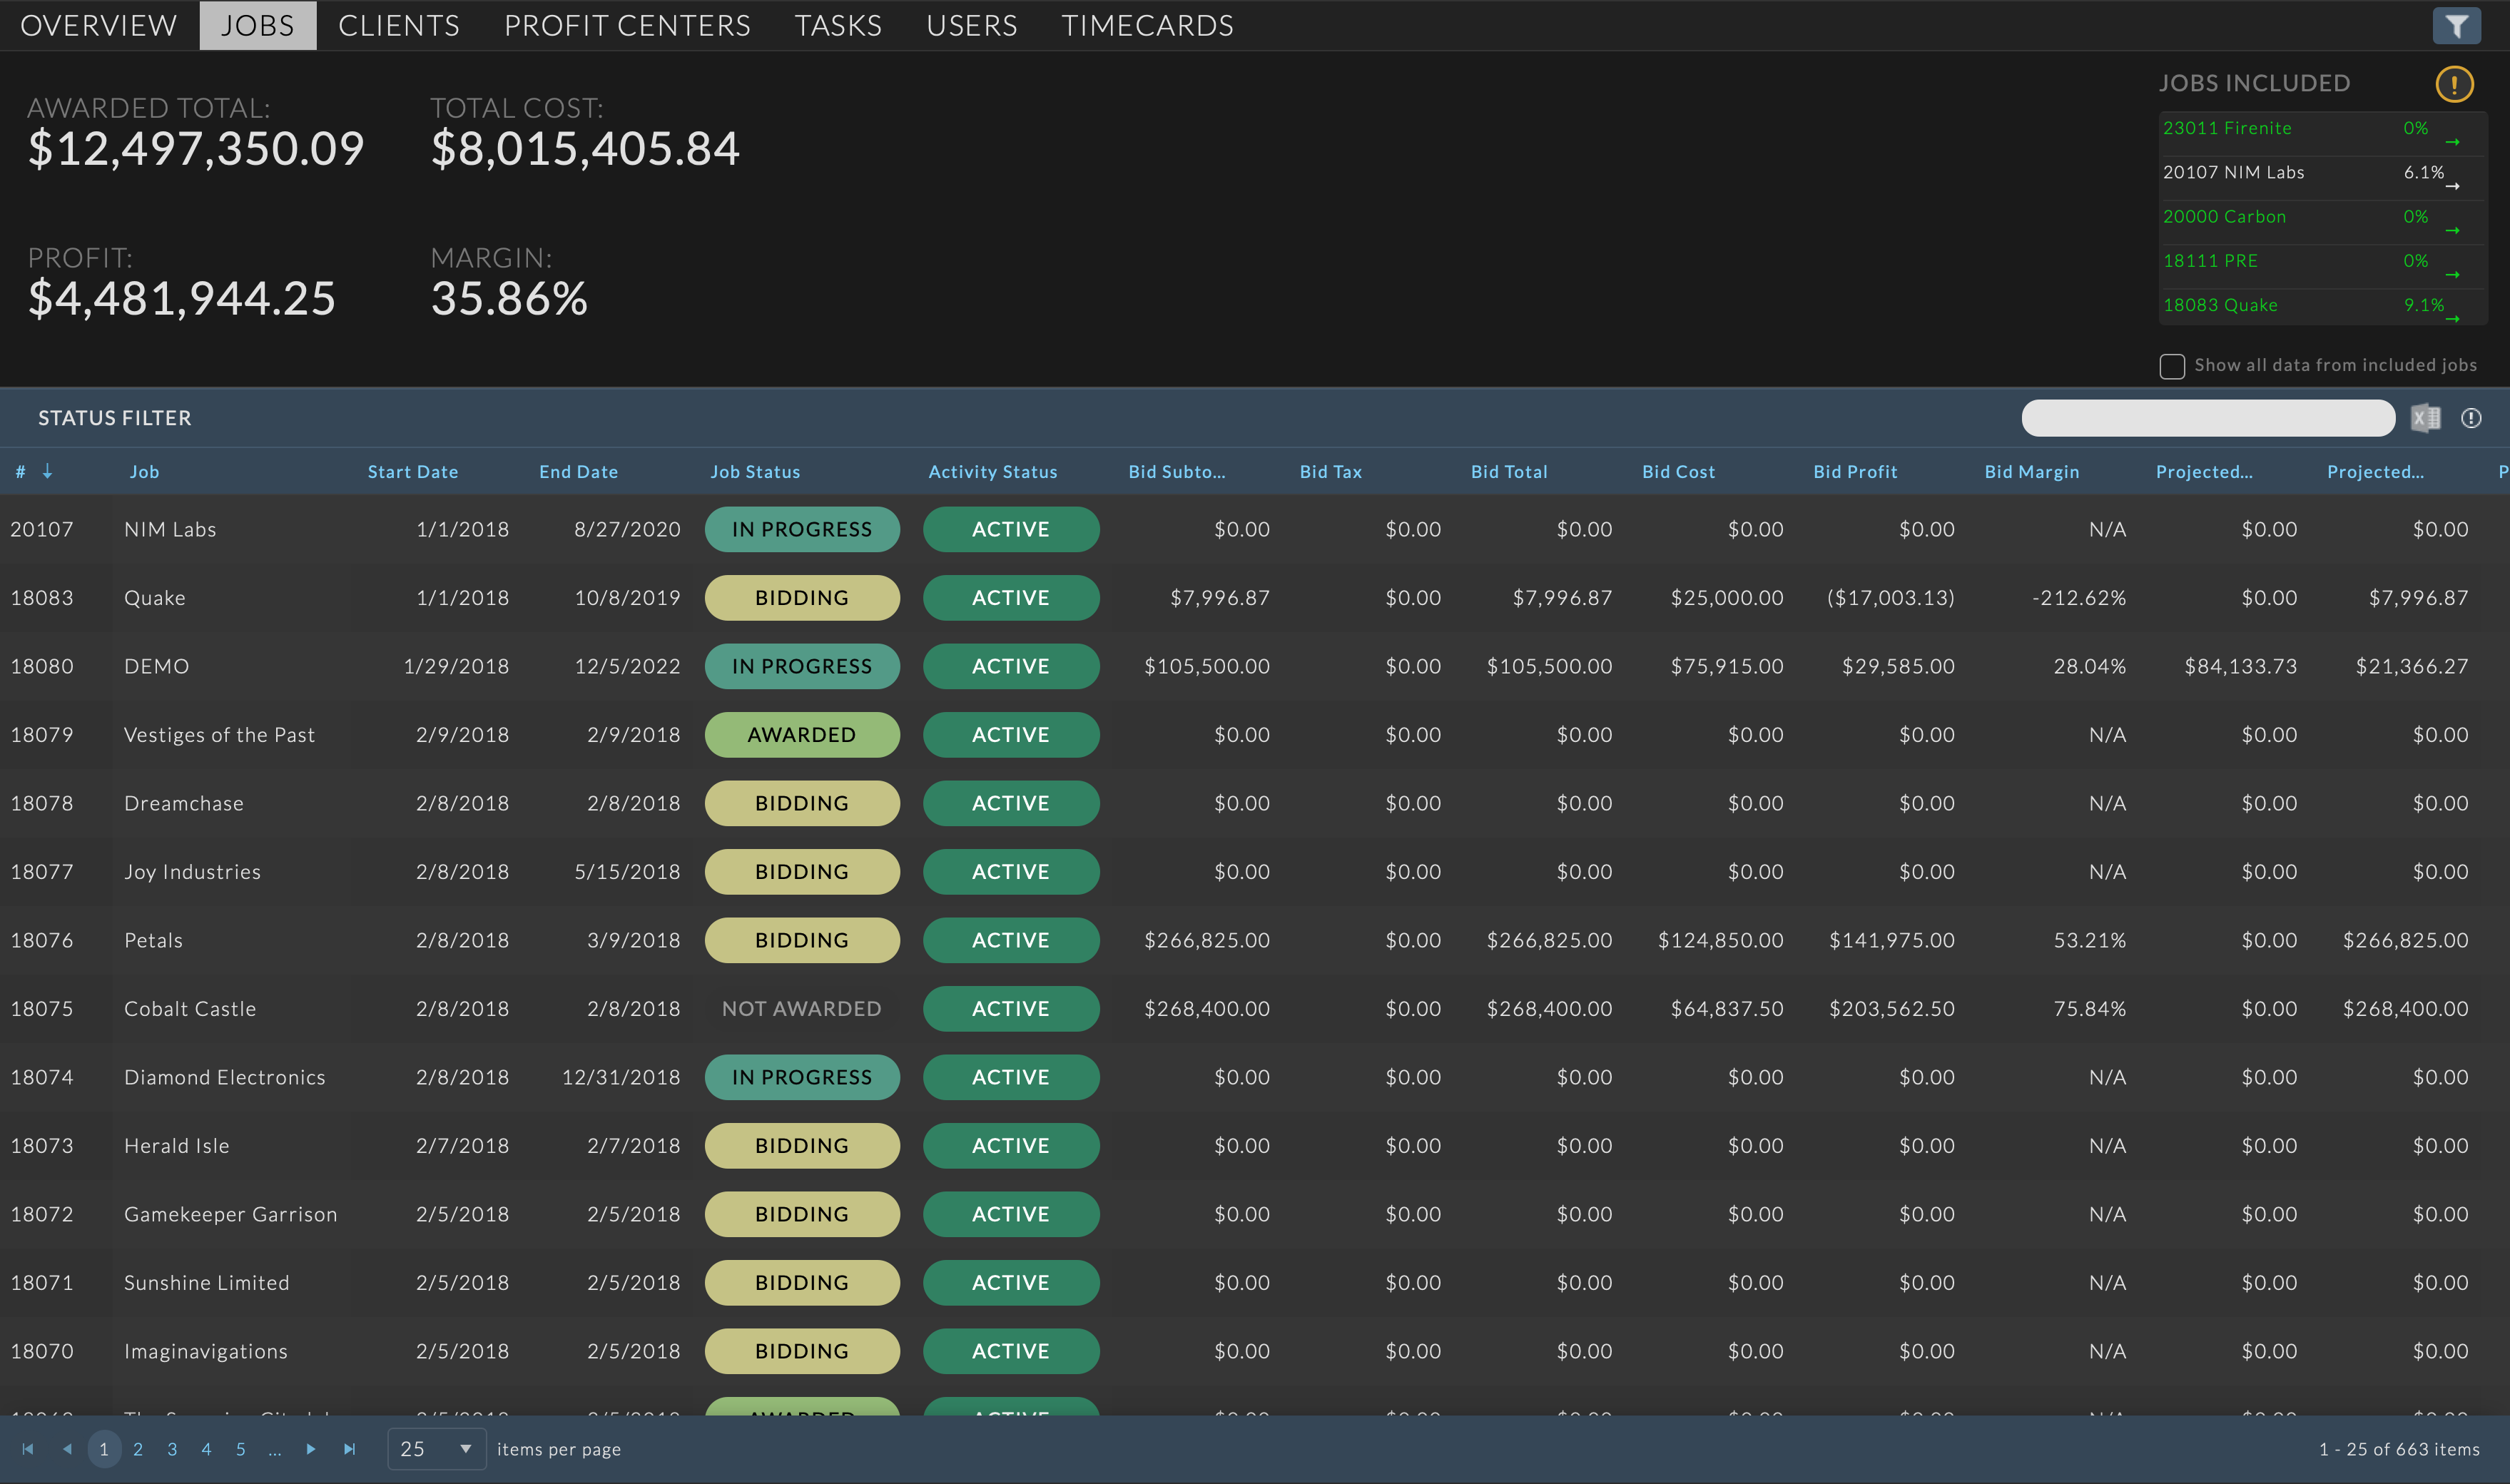
Note
This tab shows all data from all included jobs regardless of whether the Show all data from all included jobs option is checked.
Using column filtering, custom reports can be generated and exported to excel using the
button.
The information displayed here includes all job information fields in addition to:
Bid Subtotal |
The sum total of the job’s billed amounts before tax |
Bid Tax |
The sum total of the job’s billed tax |
Bid Total |
The sum total of the job’s full billed amounts |
Bid Cost |
The sum total of the job’s awarded bids hard costs |
Bid Profit |
The job’s estimated total minus the estimated cost |
Bid Margin |
The job’s estimated profit divided by the estimated total |
Projected Cost |
The job’s total projected hard cost |
Projected Profit |
The job’s actual total minus projected cost |
Projected Margin |
The job’s projected profit divided by the actual total |
Actual Subtotal |
The job’s total of all billed amounts, additional billed amounts, and adjusted reconciliation amounts before tax |
Actual Total |
The job’s total of all billed amounts, additional billed amounts, and adjusted reconciliation amounts including tax |
Actual Cost |
The job’s total of all actual hard costs |
Actual Profit |
The job’s actual total minus the actual cost |
Actual Margin |
The job’s actual profit divided by the actual total |
Invoice Total |
The total of job invoices entered |
Not Sent |
The total of job invoices scheduled but not sent |
Accounts Receivable |
The total of invoices sent but not paid |
Overdue |
The total of invoices overdue |
Paid |
The total of invoices paid |
Outstanding Balance |
The Actual Total derived from the Job Actualization minus Paid |
Not Invoiced |
The Actual Total derived from the Job Actualization minus the Invoice Total |
Job Margin Details
Selecting a row in the job margins grid will open the Job Margins detail panel displaying charts for bid, projected, and actuals margins along with a list of all awarded bids.
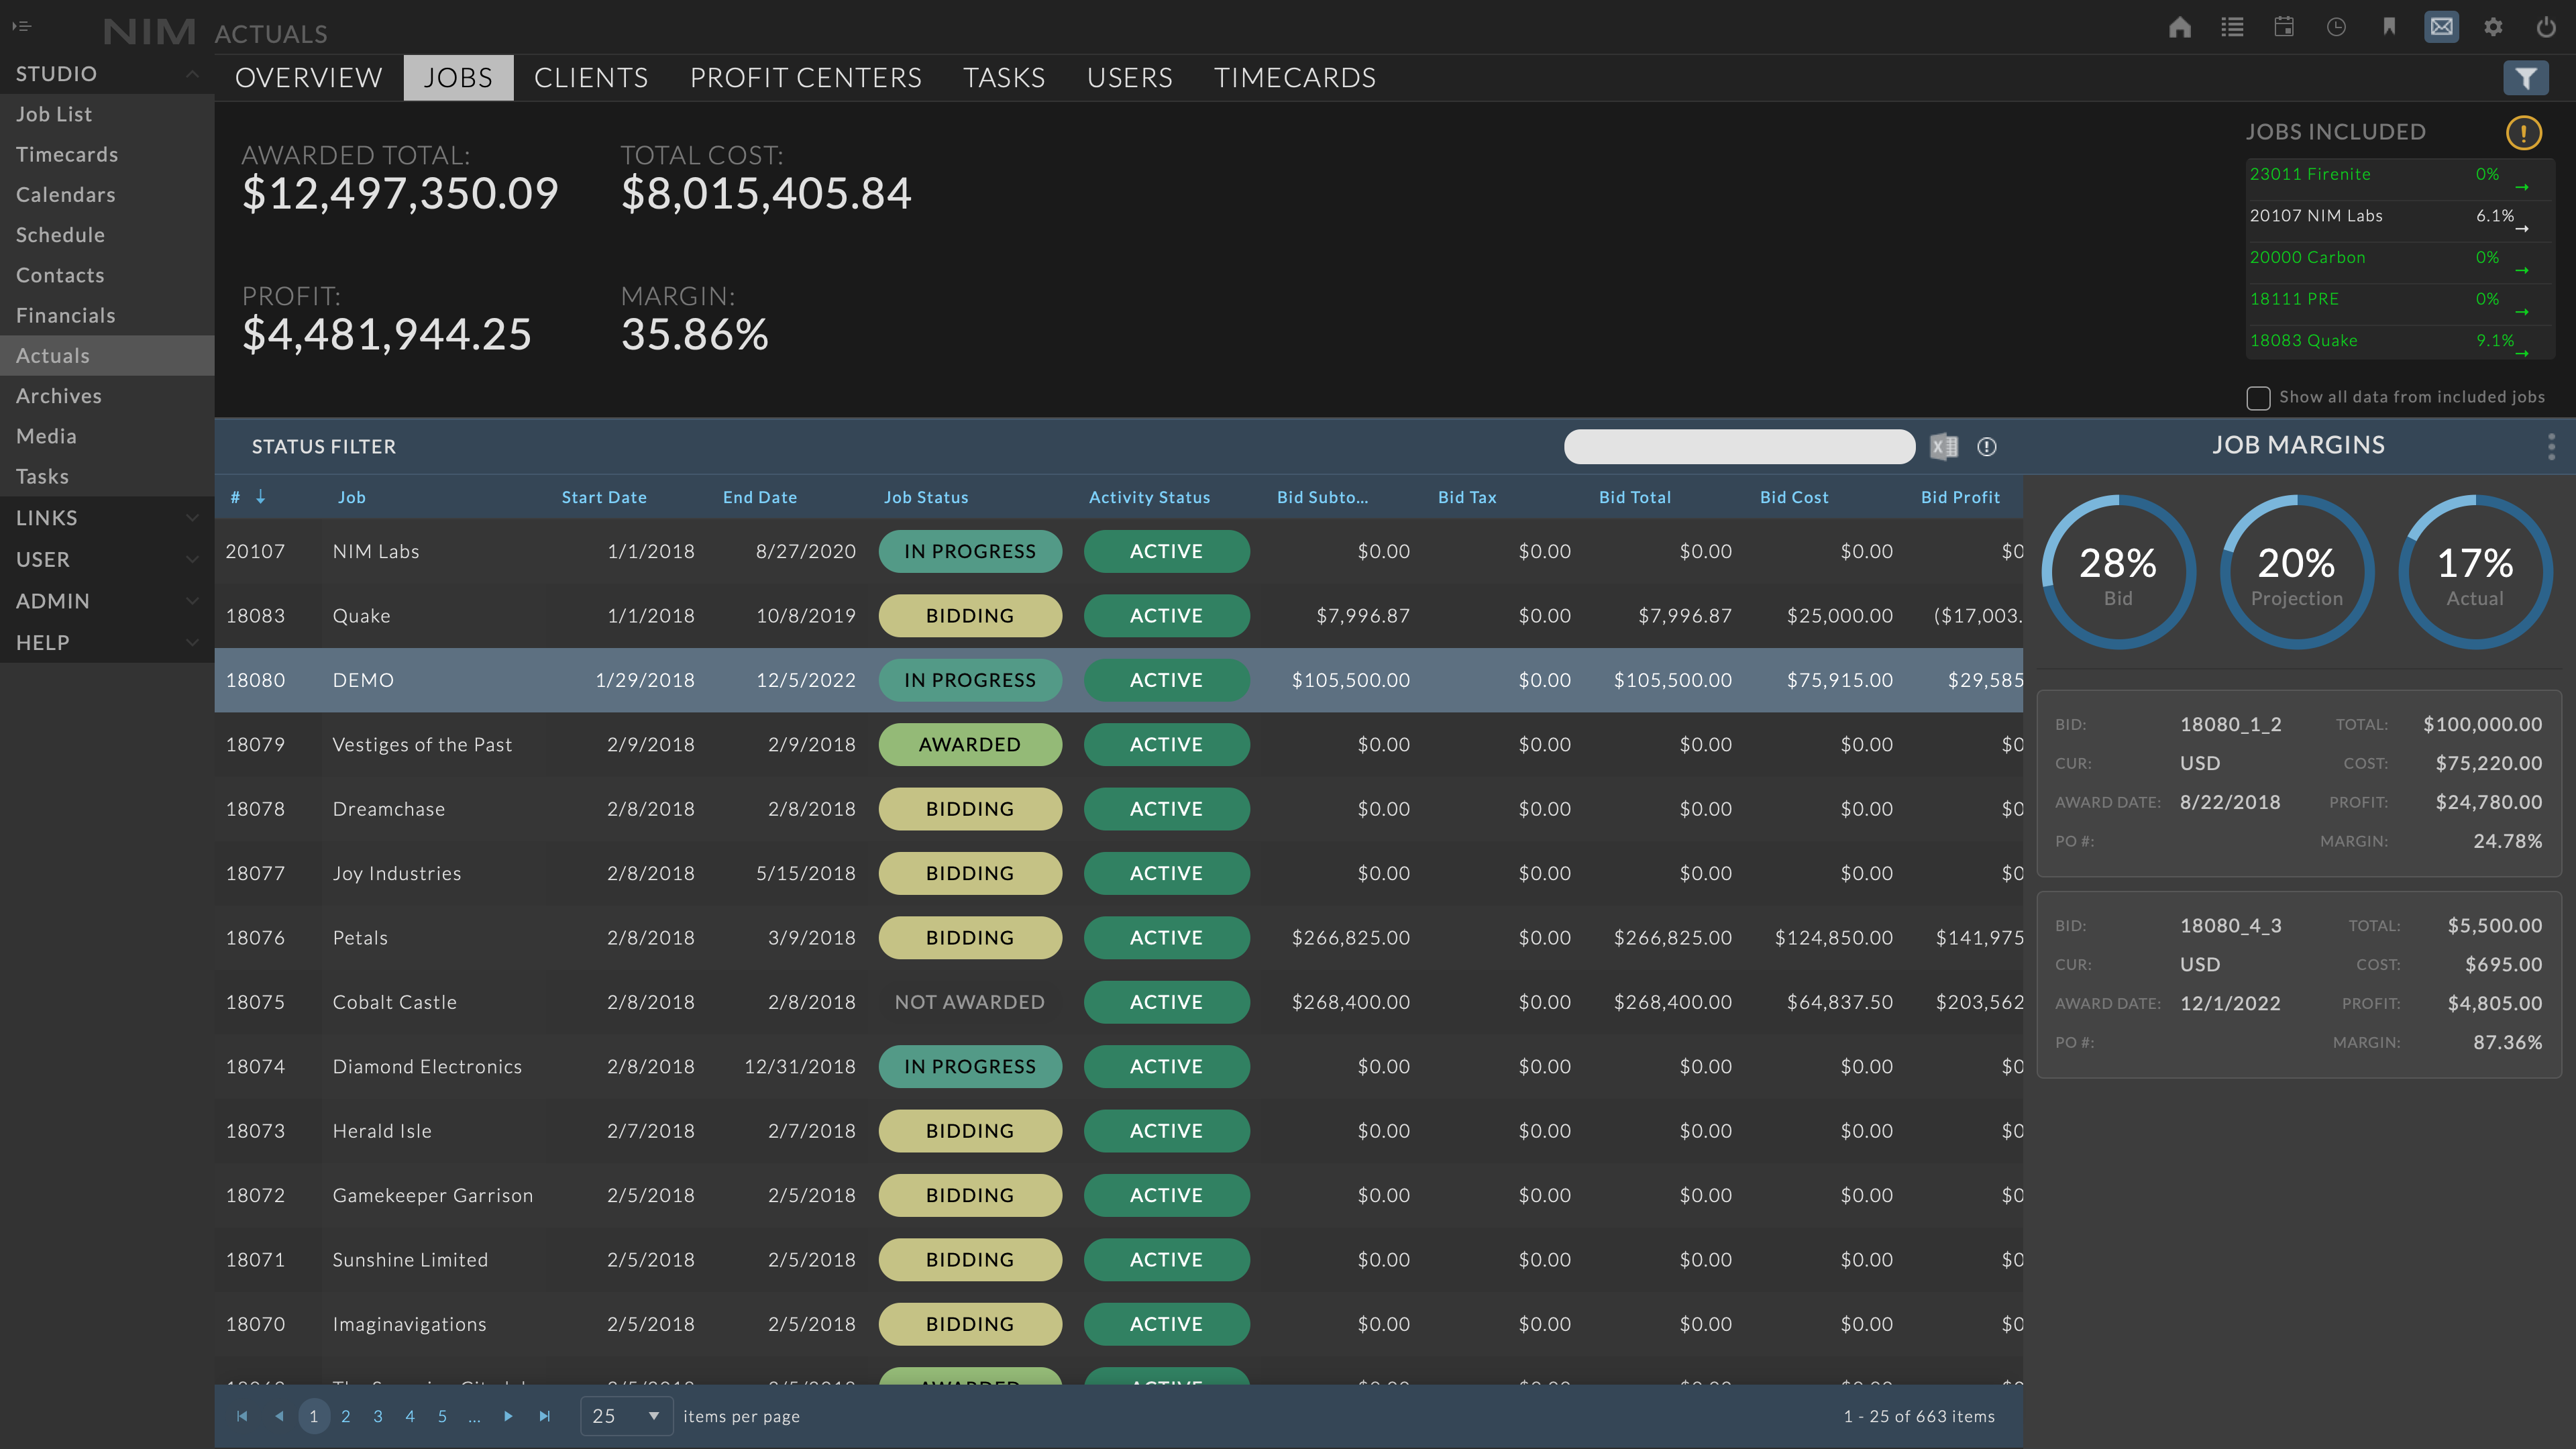
Note
The margin details are read only and are not editable from this view.
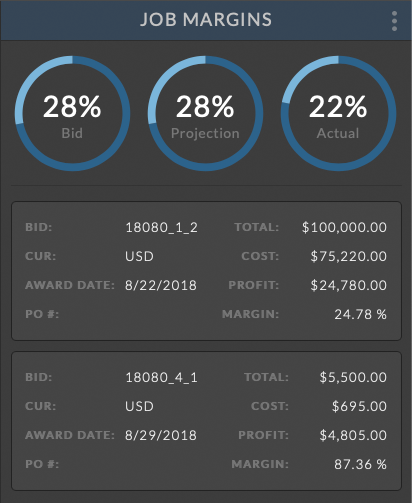
The three donut charts at the top of the panel display the total bid margin, projected margin, and actual margin respectively.
Hovering over each chart will display details for the total cost (dark blue) vs profit (light blue). Any negative values for either cost or profit will be represented in orange.
Below the charts is a list of all awarded bids on the job. Each bid section includes the following details:
Bid Number
Currency
Award Date
PO Number
Total
Cost
Profit
Margin
From the ellipsis menu you can navigate directly to the parent job’s actuals section by choosing Open Job Actuals.
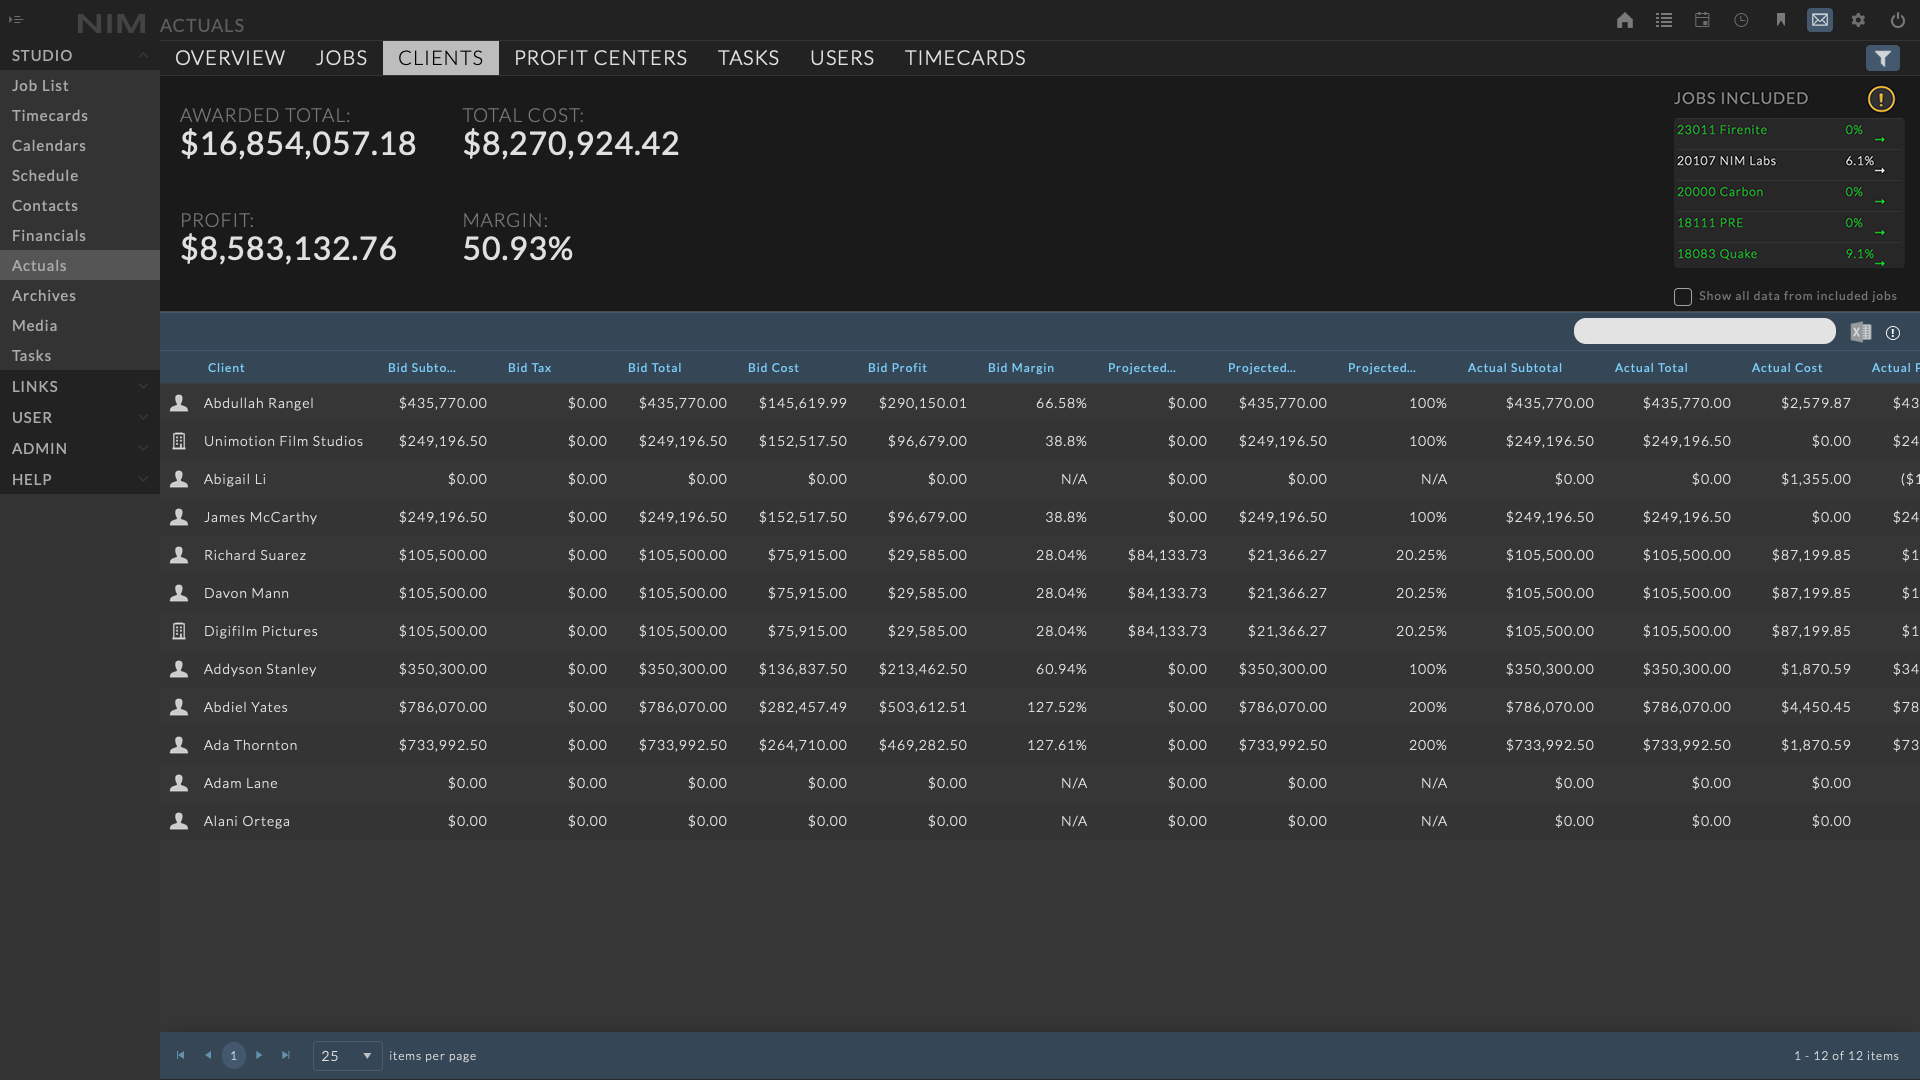
Client Margins
The Clients tab displays a grid of actualization information related to all jobs linked to client contacts with awarded bids overlapping the filtered date range.
Note
This tab shows all data from all included jobs regardless of whether the Show all data from all included jobs option is checked.
Using column filtering, custom reports can be generated and exported to excel using the
button.
The information displayed here includes the following:
Contact Type |
An icon indicating the type of contact - Company or Person |
Client |
The linked client contact’s name |
Bid Subtotal |
The sum total of the job’s billed amounts before tax |
Bid Tax |
The sum total of the job’s billed tax |
Bid Total |
The sum total of the job’s full billed amounts |
Bid Cost |
The sum total of the job’s awarded bids hard costs |
Bid Profit |
The job’s estimated total minus the estimated cost |
Bid Margin |
The job’s estimated profit divided by the estimated total |
Projected Cost |
The job’s total projected hard cost |
Projected Profit |
The job’s actual total minus projected cost |
Projected Margin |
The job’s projected profit divided by the actual total |
Actual Subtotal |
The job’s total of all billed amounts, additional billed amounts, and adjusted reconciliation amounts before tax |
Actual Total |
The job’s total of all billed amounts, additional billed amounts, and adjusted reconciliation amounts including tax |
Actual Cost |
The job’s total of all actual hard costs |
Actual Profit |
The job’s actual total minus the actual cost |
Actual Margin |
The job’s actual profit divided by the actual total |
Invoice Total |
The total of job invoices entered |
Not Sent |
The total of job invoices scheduled but not sent |
Accounts Receivable |
The total of invoices sent but not paid |
Overdue |
The total of invoices overdue |
Paid |
The total of invoices paid |
Outstanding Balance |
The Actual Total derived from the Job Actualization minus Paid |
Not Invoiced |
The Actual Total derived from the Job Actualization minus the Invoice Total |
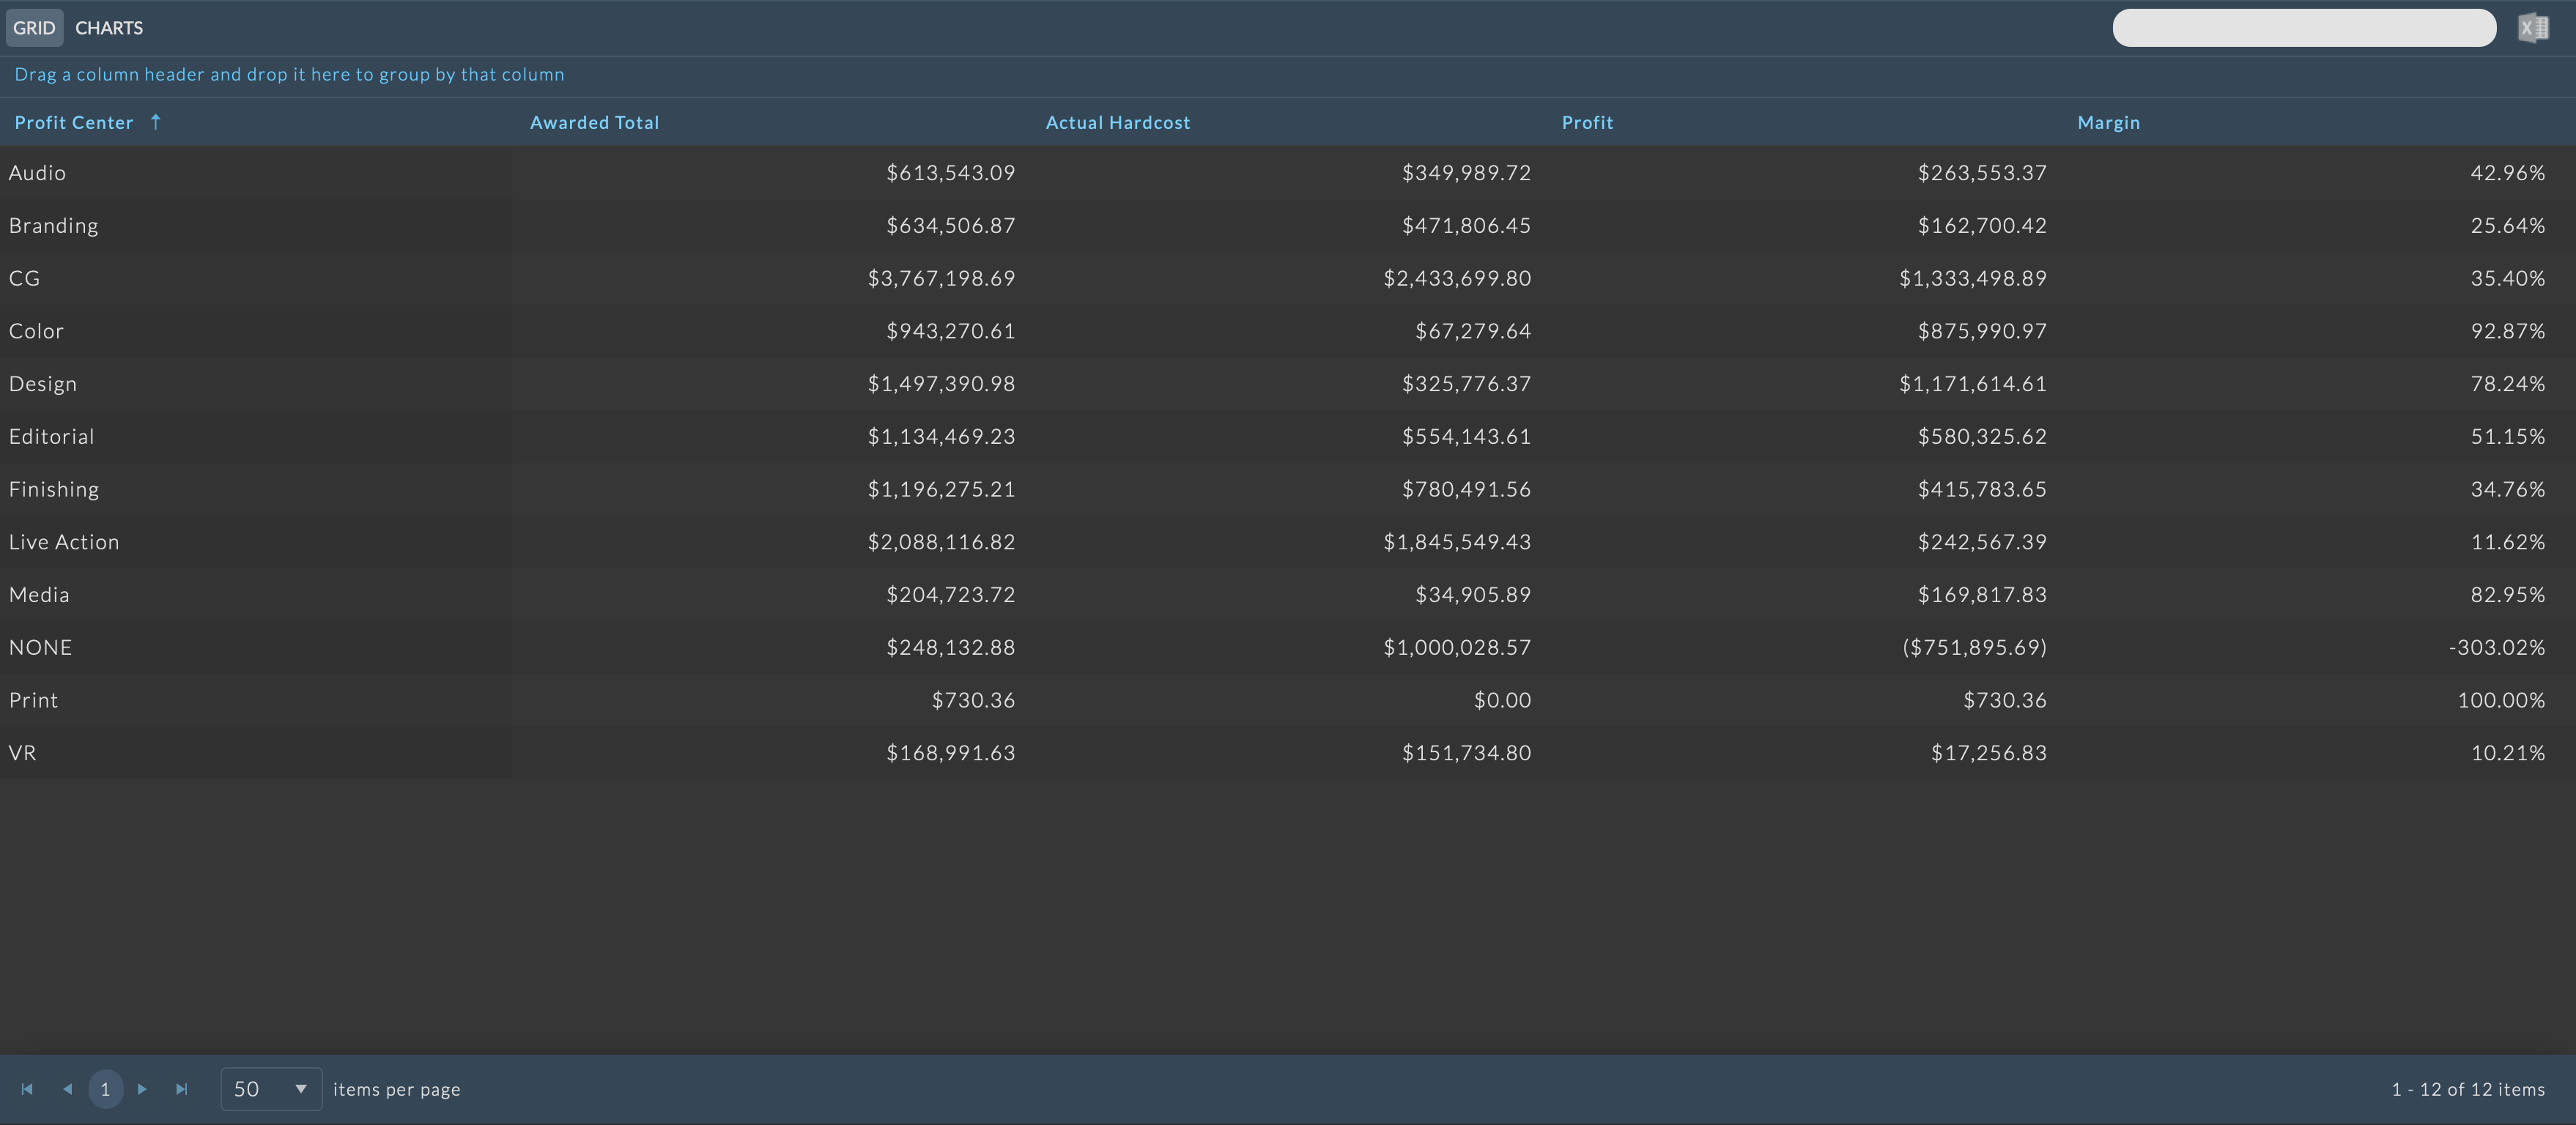
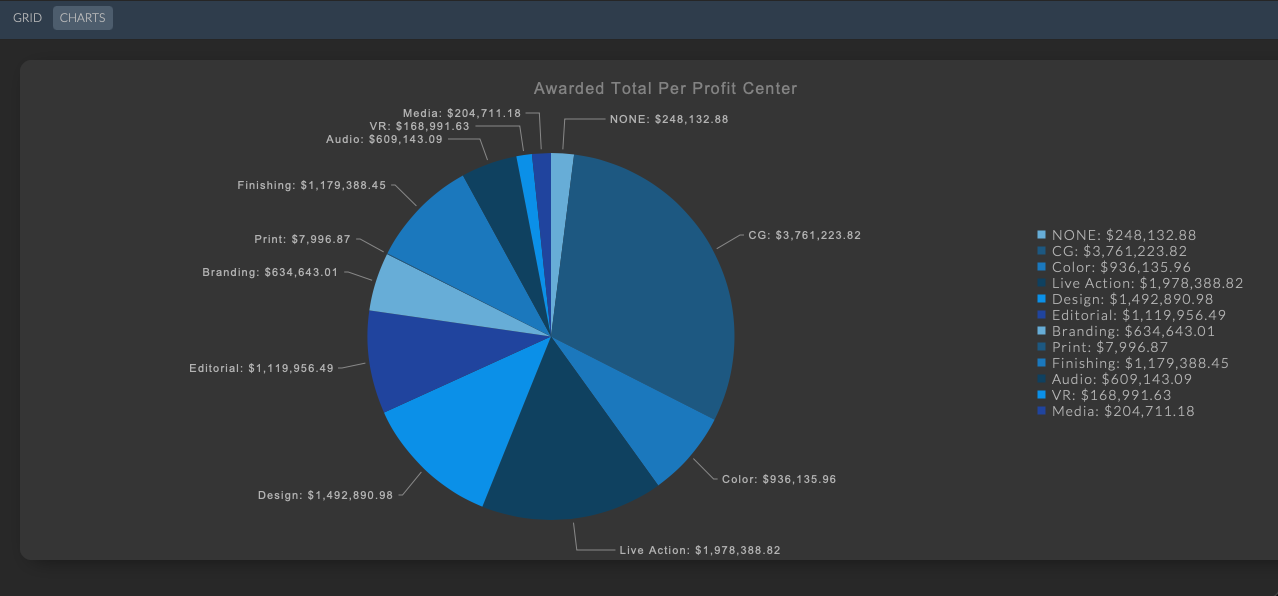
Profit Centers
Profit Centers are used to group bid line items and expenses across all jobs to determine their specific profitability. When viewing profit center totals, NIM actualizes the individual line items across jobs and awarded bids to determine profit margins of each Profit Center independently. This allows studios to see the profitability of different revenue sources independent of the job’s profit/margin.
The grid view displays the awarded, hardcost, profit, and margin totals for defined profit centers over the selected filter period.
The chart view displays the percentages of awarded totals per profit center.
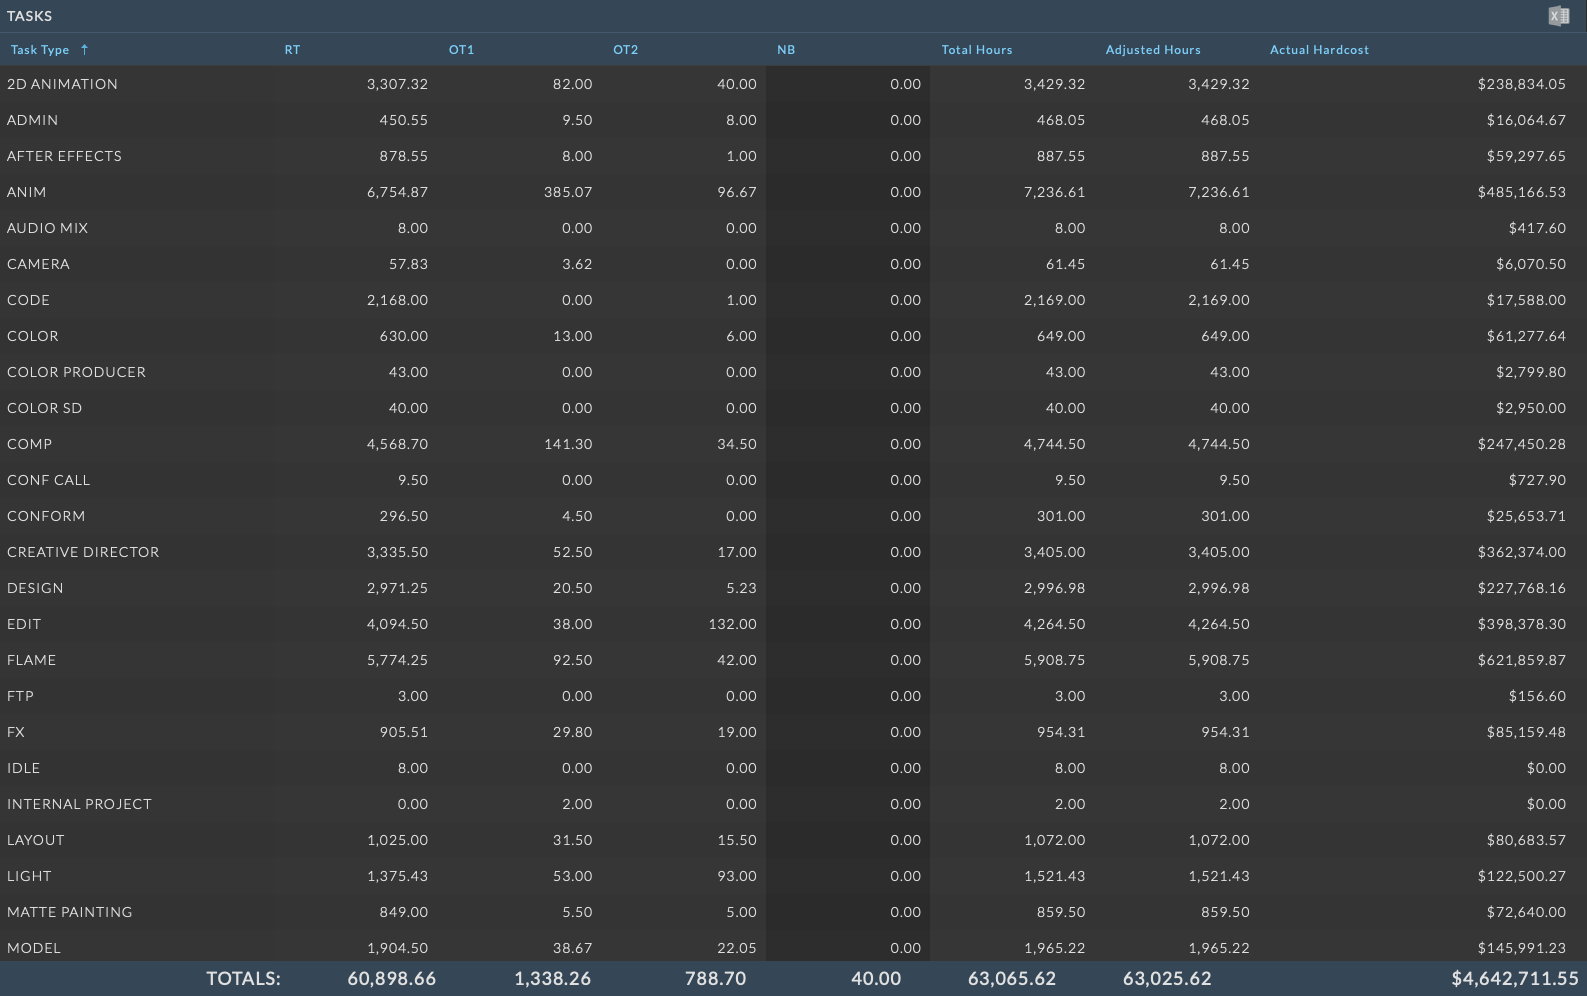
Tasks
The Tasks tab displays information related to the sum total of hours and hardcosts allocated to Tasks logged into NIM for the filtered date range when Show all data from included jobs is deselected.
If Show all data from included jobs is selected then only Tasks logged to the Included Jobs list will be displayed in the charts.
Tasks are grouped by Staff and Freelance then summarized by line item as:
Task Type |
The user who logged the hours |
RT |
The total of regular time hours based on the timecard user’s job crew settings in each included job |
OT1 |
The total of overtime 1 rate hours based on the timecard user’s job crew settings in each included job |
OT2 |
The total of overtime 2 rate hours based on the timecard user’s job crew settings in each included job |
NB |
The total of non-billable hours based on the timecard user’s job crew settings in each included job |
Total Hours |
The total of the task hours for the time period |
Adjusted Hours |
The total of the task hours for the time period adjusted based on timecard payroll rules |
Actual Hardcost |
The total of hard costs based on the associated bid line item’s hard cost in each included job’s awarded bids. |
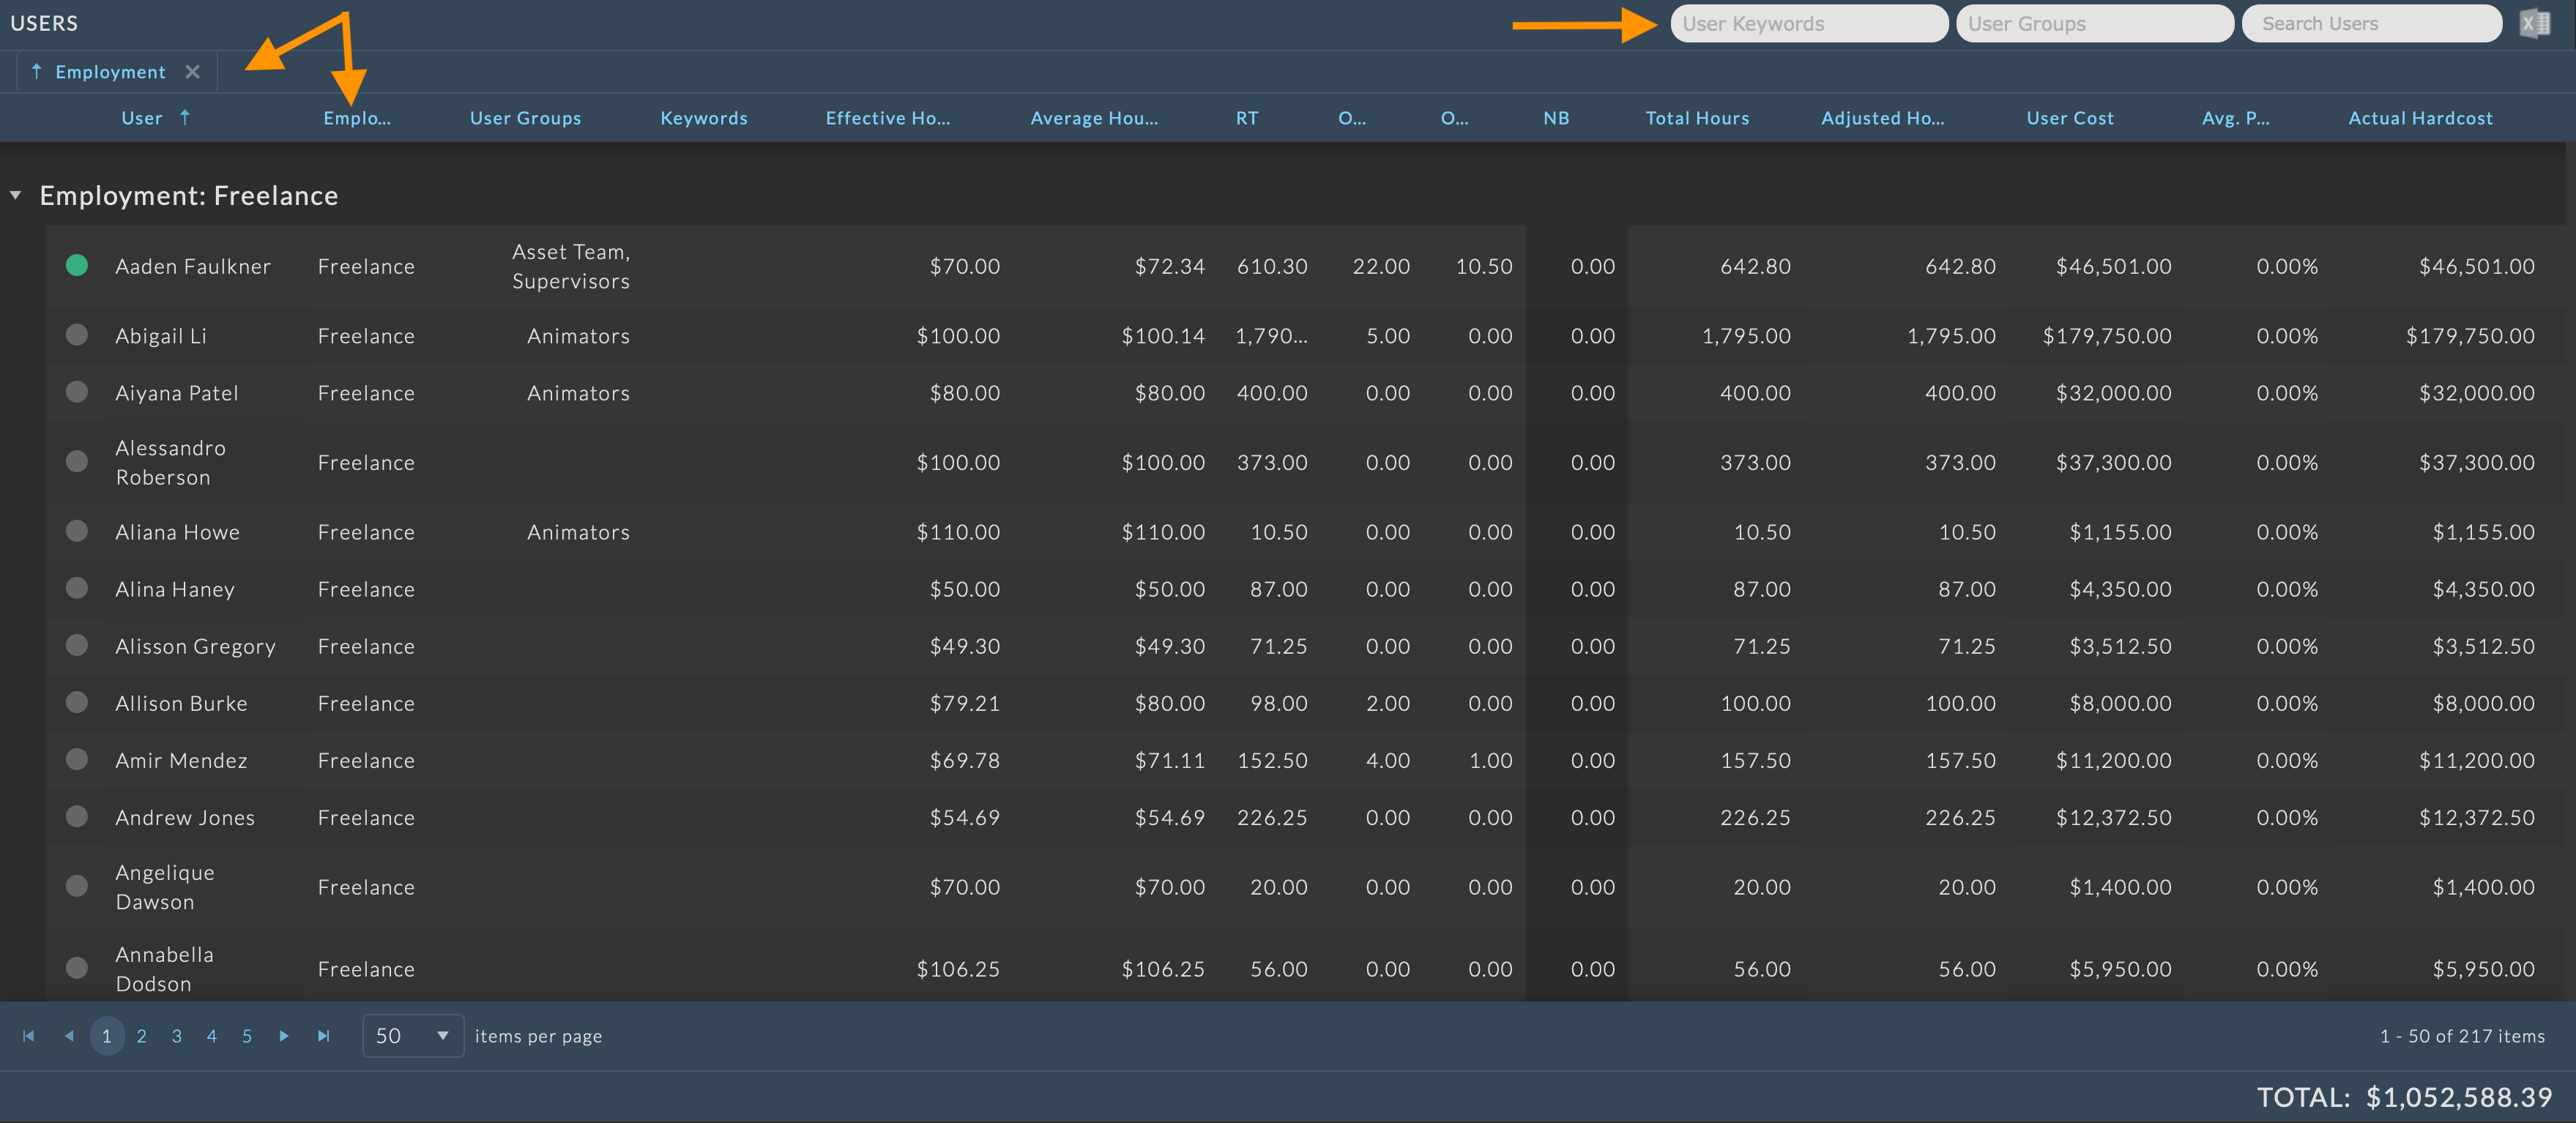
Users
The Users tab displays information related to the sum total of hours and hardcosts allocated to the Users logged into NIM for the filtered date range when Show all data from included jobs is deselected.
If Show all data from included jobs is selected then only Users logged to the Included Jobs list will be displayed in the charts.
Crews are grouped by Staff and Freelance then summarized by line item as:
User |
The user who logged the house |
User Type |
The user type defined in the user’s profile |
Employment |
The user’s employment status defined in the user’s profile |
User Groups |
The user groups defined in the user’s profile |
Keywords |
The user keywords defined in the user’s profile |
Employee ID |
The user’s employee ID defined in the user’s profile |
Directory ID |
The user’s directory ID defined in the user’s profile |
Effective Hourly Rate |
The Effective Hourly Rate (EHR) is derived from changes to a user’s rate over time as well as any hourly adjustments made to timecards via payroll rules. |
Average Hourly Cost |
The Average Hourly Cost (AHC) is derived from the User Cost compared to the total number of hours worked, regardless of any rate multipliers (OT1/OT2). This provides information on how much you are truly spending per hour on employees. |
RT |
The total of regular time hours defined by the users job crew settings in each included job |
OT1 |
The total of overtime 1 rate hours defined by the users job crew settings in each included job |
OT2 |
The total of overtime 2 rate hours defined by the users job crew settings in each included job |
NB |
The total of non-billable hours defined by the users job crew settings in each included job |
Total Hours |
The total of the users hours entered in timecards for the selected time period |
Adjusted Hours |
The total of the users hours entered in timecards for the selected time period adjusted by any payroll rules |
User Cost |
The total amount paid to the user (does not includes P&W) |
Average P&W |
The average P&W percentage for the user during the selected time period |
Actual Hardcost |
The total of hard costs based on the users rate and P&W |
Note
The difference between the Effective Hourly Rate and the Average Hourly Cost can help you determine if you are spending enough in overtime charges to hire an extra person at no additional cost to keep all employees within standard rates.
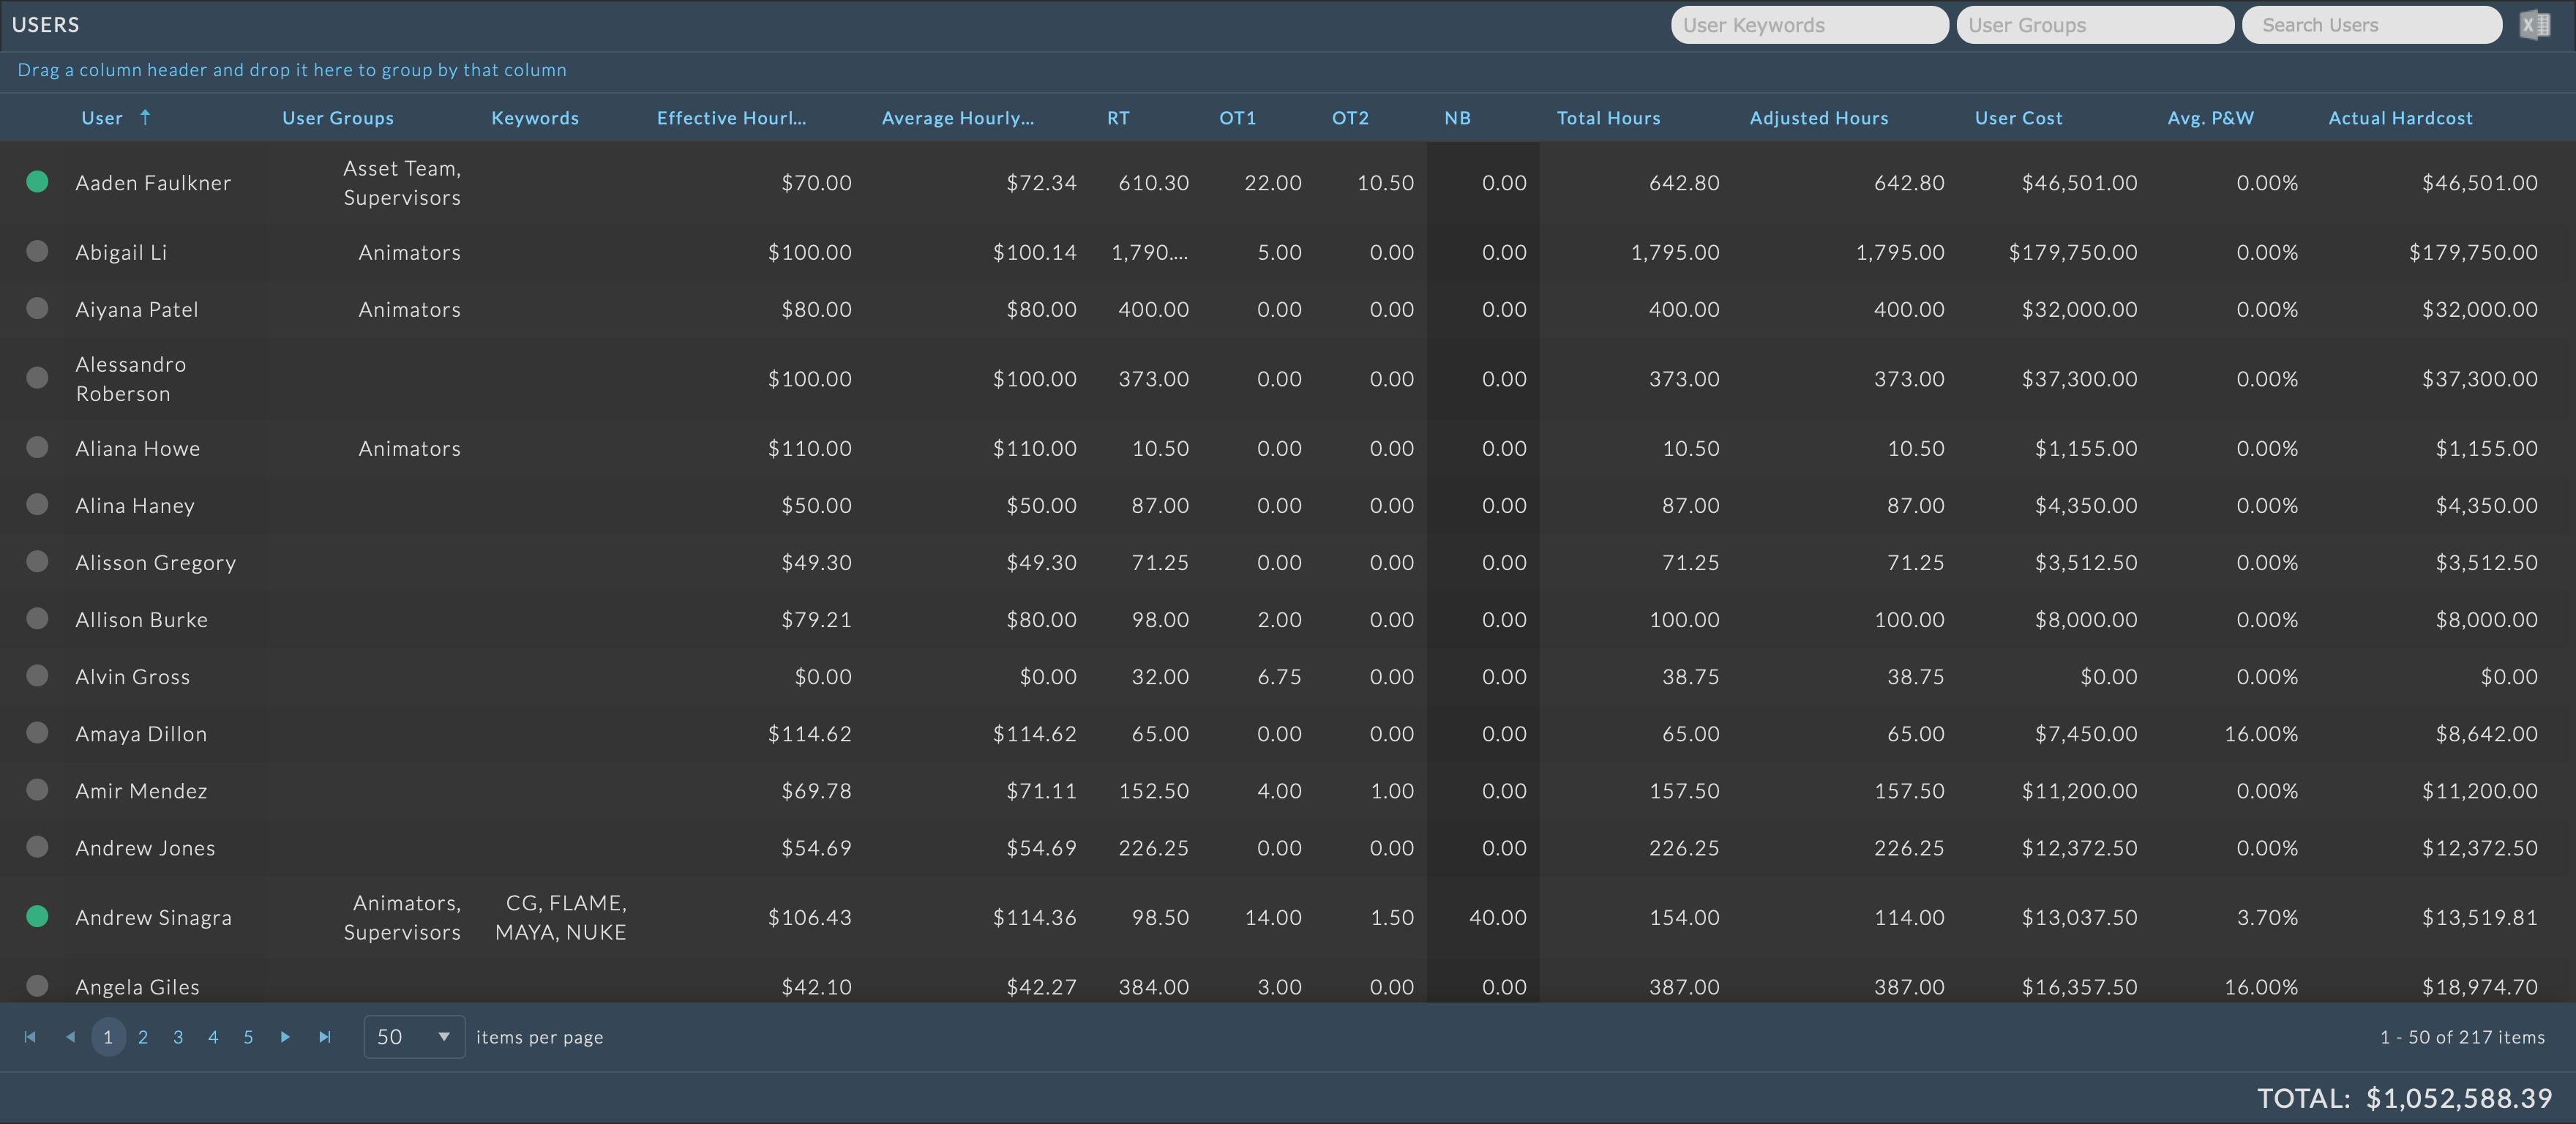
The Users grid can be filtered by user keywords, groups, and names using the filters at the top right of the grid.
Additionally the grid can be grouped by column values by dragging and dropping column headers onto the “Group” bar.
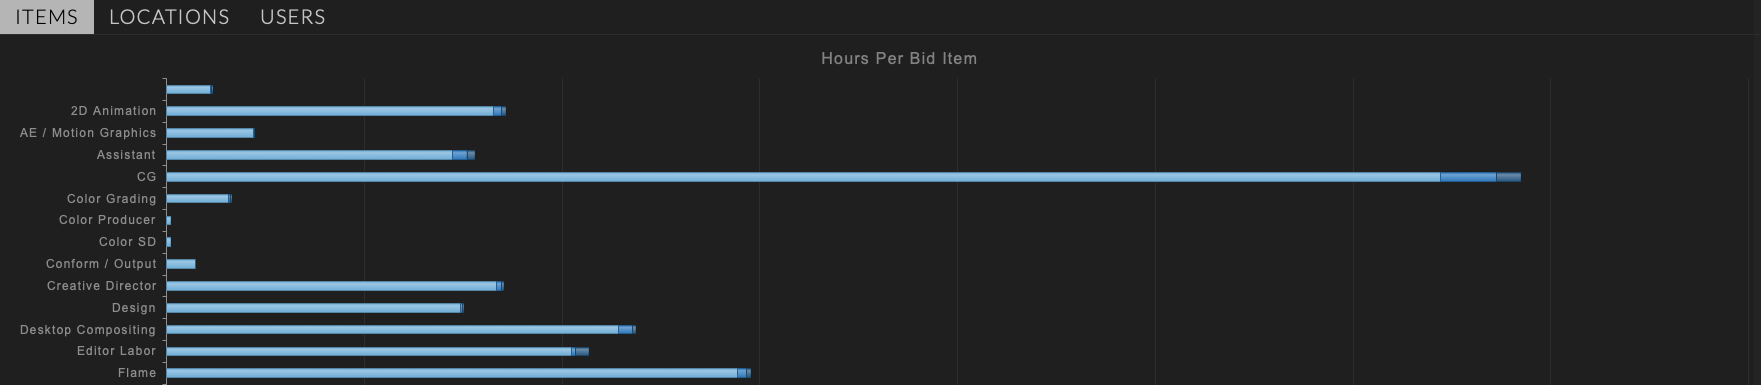
Timecards
Click on the Timecards tab to view the Studio Timecard Actuals.
There two sections to this tab both displaying the breakdown of:
Regular Time
Overtime Rate 1
Overtime Rate 2
Non-Billable Time
This areas shows the sum total of timecards logged into NIM for the filtered date range when Show all data from included jobs is deselected.
If Show all data from included jobs is selected then only timecards logged to the Included Jobs list will be displayed in the charts.
RT/OT1/OT2/NB
The top section displays the sum total of timecards logged on the Included Jobs studio wide.
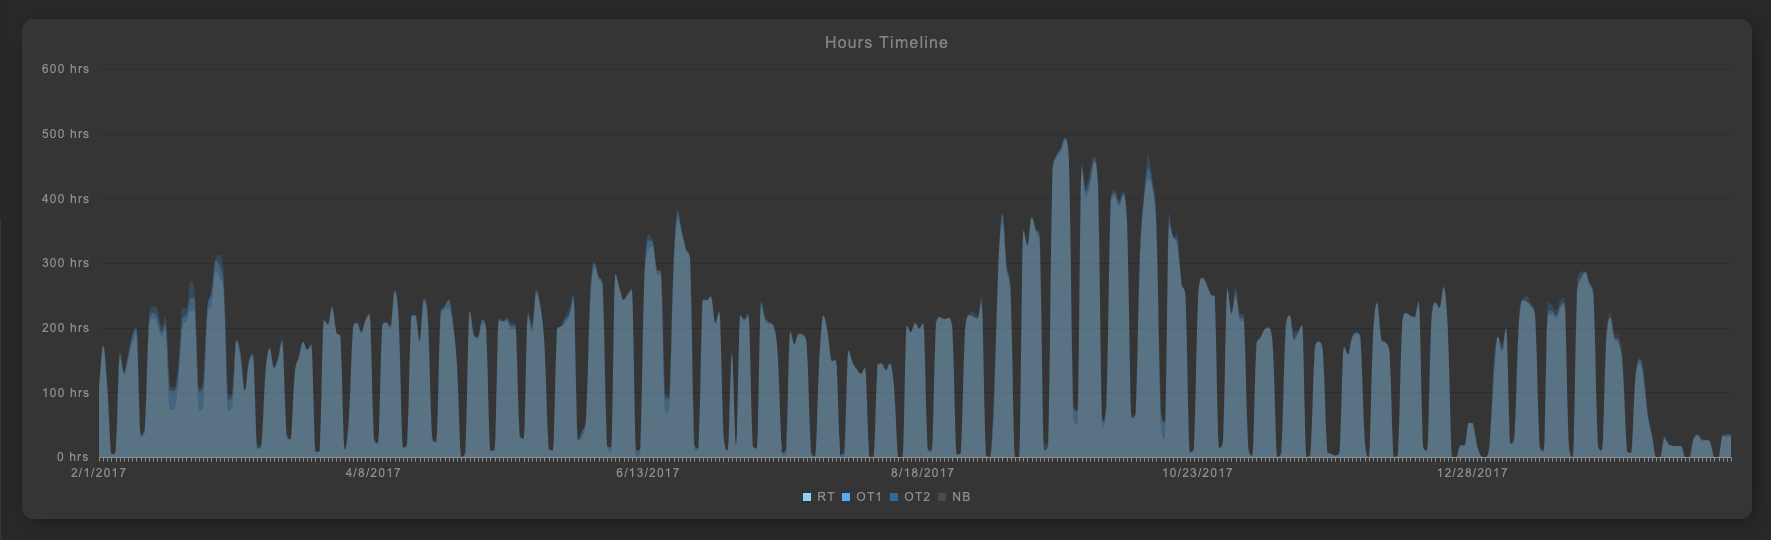
ITEMIZED BREAKDOWN
The lower section displays the sum total of timecards logged on the Included Jobs categorized by:
Bid Items
Locations
Users
Click on the associated tab to view timecards by the desired grouping.